
Performing iterative design research to enhance charting for patients aged 65+
Company: Nice Healthcare
Project duration: 2 weeks ⚡️
My role
I served as the sole UX Researcher on a Product team comprised of three Product Managers, three Designers, and ten Engineers. For this project, I coordinated all research activities, which included:
crafting a research plan
recruiting a diverse and representative group of participants
scheduling a virtual meeting to conduct both a real-time survey as well as a group discussion
synthesizing initial results and sharing them with the appropriate team members to unlock work
sharing out the new designs and launching a follow-up survey with the participant cohort
keeping stakeholders abreast of the product roadmap
creating a case study to showcase the power of iteration that I shared company-wide to 150+ employees to take them along on the journey and teach them how they can incorporate research best practices into their own day-to-day work
organizing our research repository to include these findings in an easily accessible and searchable manner
The challenge
At its most foundational level, research should always seek to support the company’s business goals by reducing risk and increasing confidence in decision-making. As such, each research endeavor should directly connect to department level objectives and key results (OKRs) and ultimately company-wide OKRs. It’s easy to get lost in “Let’s test this assumption!” without pausing to reflect on the “why” behind your potential action, but it’s crucial to the success of any research project.
With that end goal in mind, one of Product and Technology’s objectives for Q4 2022 was the following: “Our legacy technology is ready to support new business for 1/1/2023.” Within this larger objective, we had a specific key result to “Launch a 65+ solution that 90% of providers are confident in.” The key (no pun intended) is for your result to be specific, measurable, actionable, relevant and time-bound (SMART goal). All of this ultimately helped us to create a solution where we achieved 0 Medicare Errors in Q1 2023, so in addition to our OKR for that quarter, we measured the ultimate success of this work by taking a lagging measurement at the end of Q1 2023.
Our end users were healthcare providers at the company, Nurse Practitioners (NPs) and Physician Associates (PAs). The business hadn’t yet treated patients who were Medicare eligible and as such, our in-house EMR needed to be adjusted to account for this new patient population.
The research methodology
When selecting a research methodology, you should always have a clear research question in mind and a sense of the amount of time and resources you have available to allocate to the specific project. In many cases, several research methodologies would produce similar findings, but the scope of your research helps to inform the appropriate method.
In this case, we were seeking to measure confidence, so a quantitative rating survey quickly became the clear research method to achieve our goal. In order to achieve representation across the company, I recruited all 5 Clinical Managers and a member from each of their teams that represented a diversity of perspectives from gender, age, geographical service area, and experience with our in-house EMR. I then scheduled a Zoom meeting with this cohort of 10 providers to solicit sufficient feedback while also being cognizant of patient care needs.
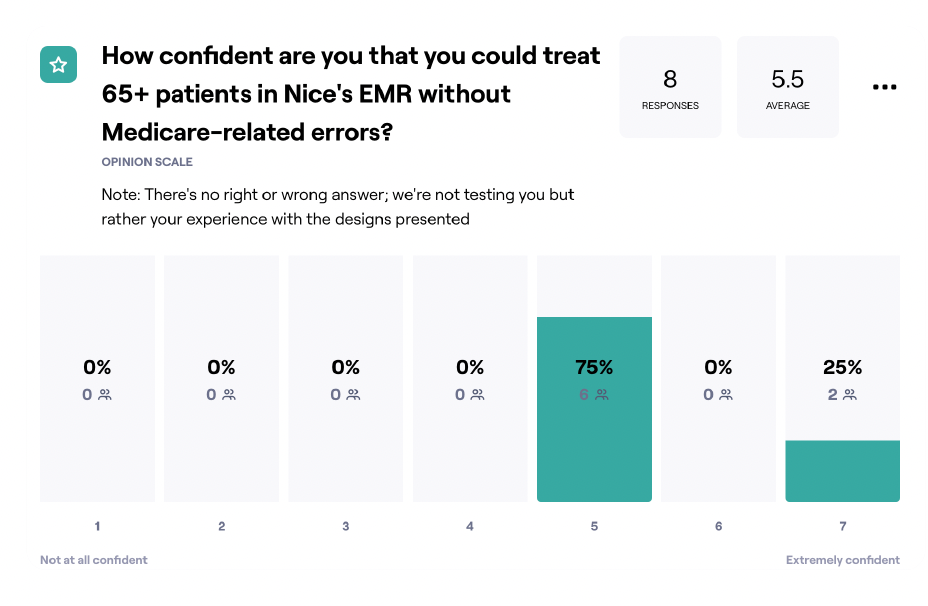
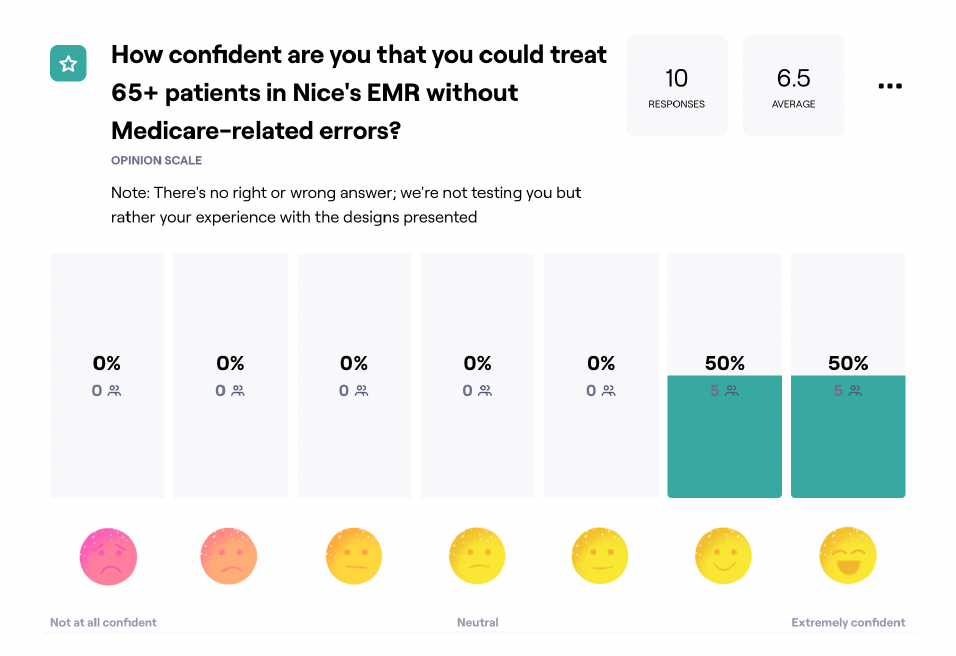
I crafted a one-question survey in Maze, the continuous product discovery platform I selected and implemented for our company’s research practice, to measure confidence: “How confident are you that you could treat 65+ patients in Nice's EMR without Medicare-related errors?” Industry best practice is to include an odd number of questions for ratings (otherwise known as Likert scales) as it allows respondents a true “neutral” response, so I intentionally made this a 7-point scale question. I sent the survey real-time during the Zoom meeting in order to solicit the most responses possible during providers’ busy workdays. In my research practice, I intentionally curate not only the research methodology, but also the way that research is conducted, based on the audience, their environment and particular needs. In this case, we were working on a short time-frame during a busy season for our business, so I tailored the research to deliver fast but rigorous results. In order to gather deeper insights to inform design strategy, I also followed up by asking qualitative questions such as: why did you answer the way that you did? How we might increase your confidence? This prompted rich suggestions that ultimately informed refined designs.
The results
The power of iteration was on full display through the results of this particular research endeavor. As mentioned, members from the Product team met with a cohort of 10 providers and solicited their feedback, both in the form of a one-question survey (quantitative data) and open-ended questions (qualitative data). The feedback provided by clinicians indicated that the following areas needed to have additional visual cues: medications, lab orders, and referrals. They also desired to have hard stops that would prevent them from ordering certain procedures that our providers were unable to bill for given the fact that they were Medicare-eligible. I met with the product manager and engineers for this particular project and it was determined that this type of modification to our EMR was not possible within the current scope, so I closed the loop with stakeholders and informed them of our proposed next steps, gaining their support. Furthermore, I met with our senior product designer to walk through the synthesized feedback provided by clinicians, gave her recommendations based on the findings, and she created refined designs. She then created a video overview of the new designs and I sent it to the original cohort, accompanied by the same confidence survey.
During our initial Zoom meeting with clinicians and managers, we provided them the following additional context to the survey: scores 1-2 translate to “Not confident”; scores 3-5 translate to “Neutral” and 6-7 indicate “Confident.”
As you’ll see in the images below, the first iteration of designs achieved an average score of 5.5/7 and a solution that only 25% of the respondents were confident in. During the second iteration, we achieved an average score of 6.5/7 and a solution that 100% of respondents were confident in.
Iteration #1
Tools & Methods: Quantitative survey, Qualitative questions, Affinity mapping
Zoom, Maze, Miro, Figma, Dovetail
Iteration #2
The takeaway
As a UX Researcher working on the Product team at Nice Healthcare, I ensured that our team created a design solution for our EMR that allowed us to treat a new patient population, while also maintaining a high level of confidence in the tools we developed for providers. I selected appropriate research methodologies that fit the research objective and scope, delivering results in an efficient and effective manner, all while building strong rapport with our clinical partners.